I think it would be much easier to illustrate things now after getting some basic ideas about inferential statistics. ANOVA is still aimed at comparing means, but among more than two groups. One may feel very strange why we need ANOVA in addition to t-test. That is because increasing the times of comparisons will increase the Type I error.
For example, I want to compare whether people with different educational levels are different in environmental knowledge. I have four groups of people (1 = primary school or below, 2 = secondary school, 3 = Bachelor’s degree, 4 = Master’s degree or above). The hypothesis I proposed is the average environmental knowledge is different across the four groups (at least one is different from others). The null hypothesis I’m going to test with the sample is all the means across the four groups are equal.

I’m continuing using the sample data about environmental knowledge.
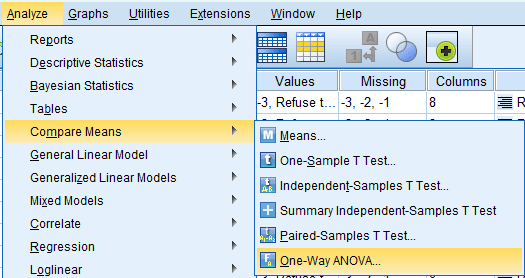
Using Analyze -> Compare Means -> One-way ANOVA
Dependent variable is environmental knowledge here, the variable that you’re going to compare. And the Factor is education here, which is the grouping variable.
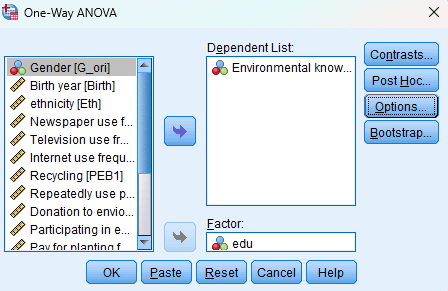
Usually, we would like to know how each group is different from the other three, so we usually need to check on one Post Hoc analysis. For example, click “Post Hoc” and choose LSD (you can choose other types of Post Hoc analysis).“Continue” and “OK” and get the results.
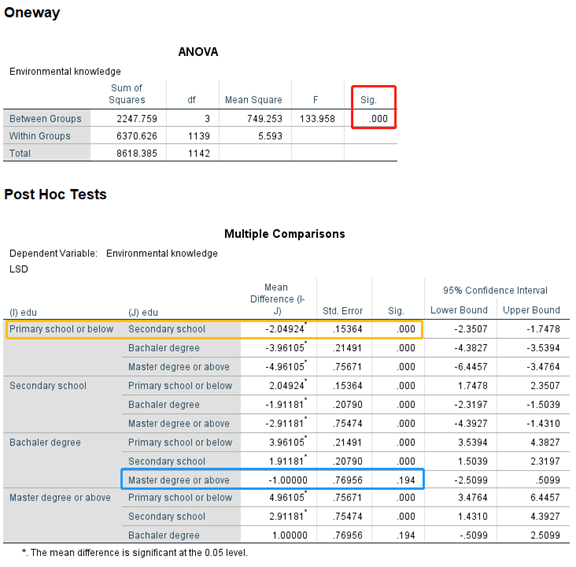

ANOVA is based on F test, you can see the p-value is less than 0.001, which means that the average environmental knowledge is different across groups. Then we can further check the post hoc tests. You can see that primary school or below is statistically significantly different from Secondary school, Bachelor degree, and Master degree from the first row. You can also find that Bachelor degree is not significantly different from MMaster’sdegree or above: the p-value is 0.194.
One-way ANOVA is the simplest ANOVA. You may see lots of types of ANOVA, I can’t even remember their names. You can find them in Analyze -> General Linear Model for different types of ANOVA in SPSS, such as two factors. They are all based on the F test.
(You may remember that in the independent t-test, we see F-test to examine whether the variances are different across the two groups. That is because the statistics for comparing the variance is also following the F distribution, so it’s F test. I mentioned this here because one student once asked me why Chi-square test is to compare difference, and there is also a Chi-square in SEM? The answer is, the aim of the two tests are definitely different. However, as the statistics formed to do the inferential statistics both follow the Chi-square distribution, they are all called Chi-square. Similarly, you can see t statistics in t-test, you will also see t-test in regression because the coefficients of OLS regression follows the t-distribution. OLS basically uses t-test to examine whether the coefficients are significant or not. Also, you can see F test in regression as well, which is aimed at examining whether all the coefficients are differed from 0.)

Leave a comment